
A Post Caught My Attention
I noticed a post on LinkedIn. A book published by Allen Carroll titled “Telling Stories with Maps”.

I noticed a post on LinkedIn. A book published by Allen Carroll titled “Telling Stories with Maps”.
Another book about maps, right? Well, not quite. In a smaller print at the bottom of the cover of the book was written, “Lessons from a lifetime of creating place-based narratives”.
Yes! I want this book because it looks like the kind of storytelling mapping journey I could learn from. What also caught my eye was the book cover design, all these interesting infographics and design elements, with a graphic of a globe at its centre. Illustrations, towards storytelling, and digital production. I eagerly contacted Allen Carroll, and he was happy to accept my invitation for this conversation.

Allen Carroll has spent a lifetime loving maps.
Like most of us in the Geographic Information Systems (GIS) field, our story began with a childhood memory of making a crayon-drawn map or looking at a detailed cartographic masterpiece in our home. Allen Carroll didn’t begin his journey in the realm of GIS per se, but he excelled in writing and illustrative design in academia with a background in geography. He made the choice to explore his illustrative talents by starting his career as a freelance illustrator. From one of his freelance pieces published in The Washington Post (Dupont Circle)[1], he was hired on in the National Geographic Magazine art department, working on infographics and historical reconstruction. After moving to the National Geographic Society’s map division, he worked amongst cartographers to produce the Centennial Edition of the Historical Atlas of the United States in 1988, before becoming the Chief Cartographer at National Geographic Society. After 27 years at Nat Geo, he joined the Environmental Systems Research Institute (ESRI). Allen has been with ESRI for approximately 14.5 years and is the program manager who leads the editorial team that publishes ArcGIS StoryMaps and promotes their use by others.
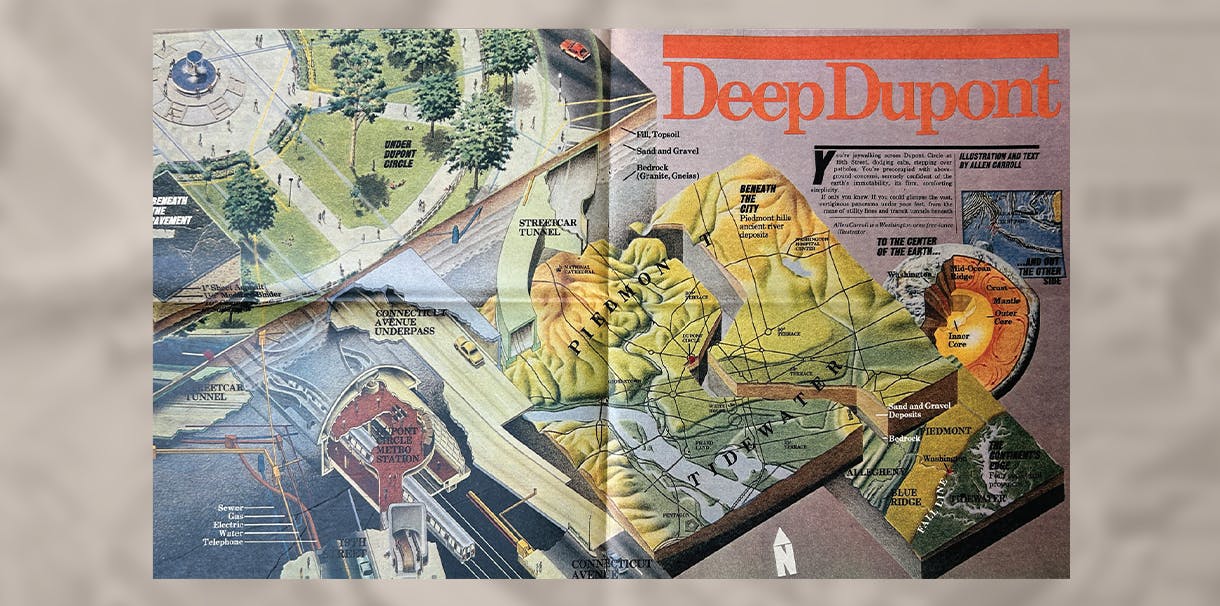
[1] Washington Post – Dupont Circle.
Illustration at Its Mapping Core
For many mapmakers, the journey began with drawing. We know about sketching a network of pencilled streets, from one place to another. Allen Carroll, in his early years, compiled many hand-drawn illustrative works. His love for exploring nature, in particular bird watching, provided a base for journaling with hand-drawn maps. Throughout his life, he has surrounded himself with maps, on family road trips, providing campus direction locations, recording field trips and various other vacation walking trails, including visiting Asa Wright Nature Centre in Trinidad, my homeland. Allen smiled as he described being in this magical place, surrounded by hummingbirds.
Allen’s love for nature and place provided insight into illustrative journaling and storytelling, broadening his imagination in the production of a variety of large-format hard copy maps, producing cartographical masterpieces for the National Geographic Society, such as the supplement map on the Korean War[2].
Allen reminisced about his years at National Geographic Society, where he enjoyed the company of some of the world's best storytellers – writers, photographers, illustrators, videographers, and cartographers. He brought the “design first methodology” to ESRI, which meant bringing together all these various storytellers at the table to discuss processes, and as a result of the discussions, illustrating exactly what the ArcGIS StoryMap platform should look like, ensuring that anyone could use it. Allen expressed that making a story map should be informative, but mostly it should be fun!
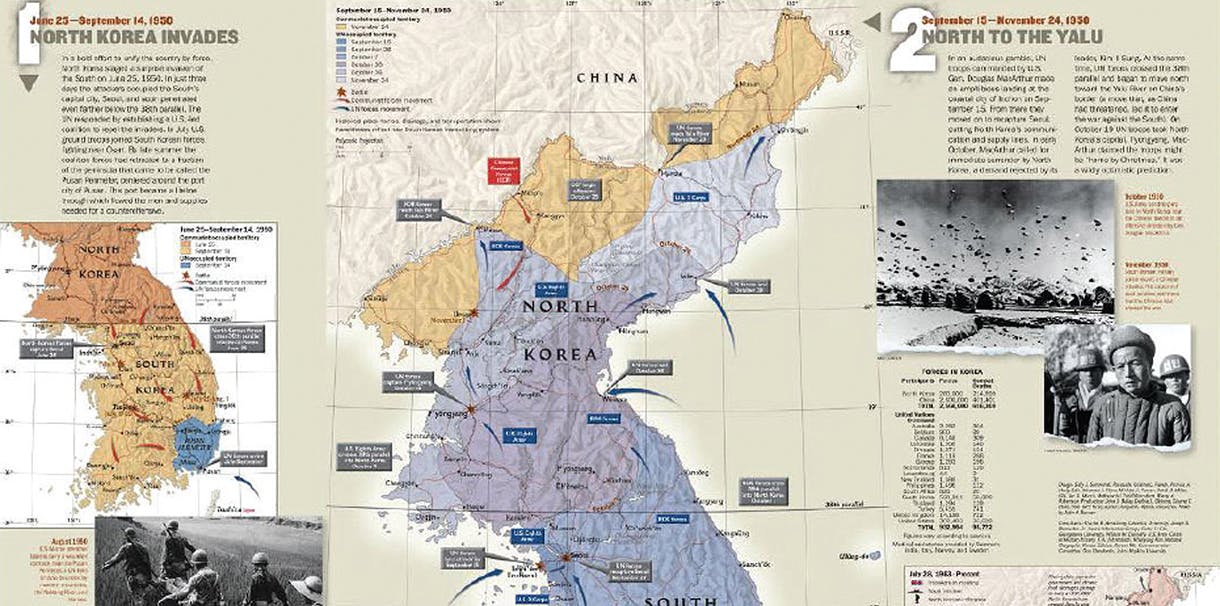
[2] Snippet of a National Geographic Society supplement map on the Korean War.
Today, there are some 4000 stories being told per day using ESRI’s ArcGIS StoryMaps
Where to Start
ArcGIS StoryMap content includes, but are not limited to, historical passages and stories of artifacts, personal journals containing hiking trails, resumes, client-visual project discussions, causes for immigration, migration of birds and animals, ecosystem and deforestation changes due to climate change, to name a few.
We spoke about the chaos involved in providing context to a story map. There are sometimes so many elements as support materials to be captured within a story, how do you know what to keep and what to get rid of?
After so many years in either creating or viewing thousands of stories, Allen was able to list 15 different types of story maps, which he placed into five overarching categories. These five are:
- 1
Understand
- 2
Educate
- 3
Explore
- 4
Document
- 5
Entertain
Allen also emphasized that these five categories were not to be seen as set in a category, but that they may overlap into more than one of these.
In his book, Allen also provides a go-to resource that he refers to as his “broad strokes to building an engaging story map”; he refers to it as the “Nine Steps to Great Storytelling”. His disclaimer is that the nine steps should be used as a guide to someone who needs a bit of a starting point, but it should not be treated as rules for storytelling.
The next step to keep in mind with storytelling is the basis of making an impactful story by gathering the 5 Ws and the 1 H - Who, What, When, Where, Why and How. Depending on the context and the hero of the story, there may be bias on which of the six will have more emphasis than the others.
“Think big, think small”, scaling in creating maps is crucial in providing the clarity of where the topic is located. Start with a local example to illustrate larger global issues, or vice versa, using zoom in and out between overview and case studies.
The planning involved in creating a story map can be as simple as a few photos with explanations and related numbers on a map, or it can involve many more intricate interactive applications and design elements. Adding a ‘hero’ (human or animal) makes global problems more relatable and empathetic.
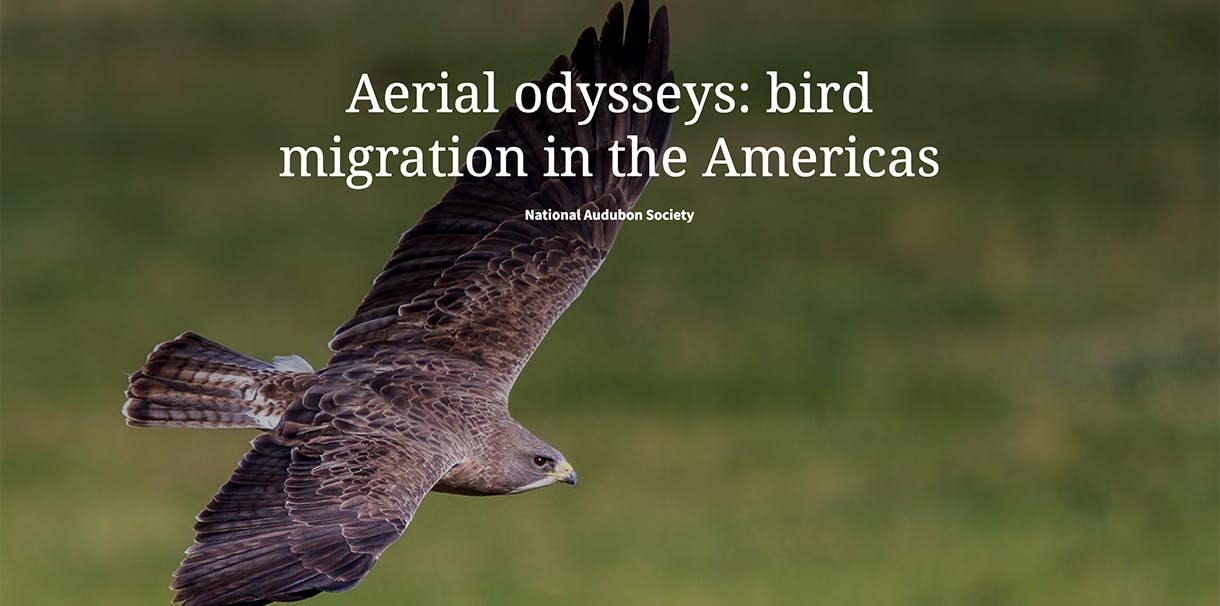
[3] ArcGIS StoryMap cover page on a migrating Swainson’s Hawk.
Navigating the Digital Age
At the National Geographic Society, Allen, as the senior map person, collaborated with ESRI in 1999 to provide an online experience called “MapMachine” (this was before Google Maps), which was an online resource providing a selection of interactive thematic maps. In the spatial world, information is referred to as data. Allen and I discussed that data was not being shared as widely as it should be,
data is being held captive and should be liberated and that part of the process of liberation should be explaining and interpreting the data or, in a sense, making data a good citizen.
At ESRI, ArcGIS Online is the platform used to create, design and publish web maps and in turn these web maps are used within many web applications. One application is ArcGIS StoryMaps. Allen spoke about the various types of stories that have been added each year. There are always new styles and approaches being created by users of the platform to share visions, calls to action, educate and many more story topics.
Developers are part of the ArcGIS StoryMaps team and were added as the platform’s popularity grew. The difference with the ArcGIS StoryMaps team is that there is a design-first attitude, which separates ESRI’s approach from traditional software development, which usually starts with developers. The editorial and design team have provided ideas and found new ways to focus on making the story creation experience smooth, intuitive, and fun for users without coding requirements. See image of Migrating Swainson’s Hawk[3].
We can’t end this area of our discussion without speaking about the dawn of AI and how it will affect ArcGIS StoryMaps in particular. There are three AI-driven features planned for the Story Maps platform: Insights (AI analysis of story length, language accessibility), Style Assistant (Semi-automated design/style creation), and Writing Assistant (Generative AI for text improvement). These are now offered in beta format, with the AI option off by default, with the ability to opt in only if authorized to address any concern in AI use. Allen explained that the above AI portion is only briefly mentioned in the book because of the release dates.
Conclusion
Presently, there is heavy usage of the ArcGIS StoryMaps platform amongst the education community; it serves as an alternative to traditional research papers, empowering students with intuitive digital storytelling tools. This is evidenced by a Dashboard application in ArcGIS Online, which shows a peak of ArcGIS StoryMap submissions during the educational calendar and a valley or dip in the count of submitted stories during the various holiday breaks in the year. I was amazed at the number of stories online from K-12 to University level using this as a supplement to their work.
This conversation with Allen Caroll was enlightening and informative. There are so many ways in which ArcGIS StoryMaps can be used to enhance information for the wider public. I wanted this conversation to be light and not overly GIS-centred so that everyone could benefit from the Story Map vision and perhaps consider the use of mapping as part of your storytelling journey.
Thanks to Allen Carroll for sharing his journey, advice and insight into the world of “Telling Stories with Maps”!